AGENTIC ENGINEERING
MCP Workbench: A Protocol Debugger for Tool-Using Agents

Nick Lotz
Content Engineer
Last updated: January 23, 2026
January 23, 2026
10 min read


Join thousands of developers building the future with Orkes.
If you’ve worked with AI agents for any length of time, you’ve probably hit the following failure mode:
☑️ Your server is up
☑️ Your endpoint responds
☑️ Your schema looks fine
❌ But the client still behaves like it has forgotten all previous context
...or fails without a useful error
...or the agent “tries” and then quietly routes around the tool like it never existed
It’s tempting to treat that as either model failure or failure in agent logic. But most of the time, the issue is both more mundane and more fixable. It’s the protocol surface area.
The Model Context Protocol (MCP) is deliberately ambitious: it standardizes how AI clients interact with external resources. That standardization is what makes it plausible as a useable abstraction for building AI agents and their integrations. It’s also what introduces a real engineering reality: protocols need debuggers.
That’s where MCP Workbench comes in. We've released MCP Workbench as a visual test client for MCP servers. It’s designed for developers to debug MCP end-to-end. You can see exactly what the client sends and what the server returns (raw JSON-RPC payloads, responses, and errors), plus the handshake, session, auth flow, and the tool schema that governs what can be called.
In this post, we'll:
MCP is a JSON-RPC protocol that allows clients, particularly AI LLM agents, to discover and use tools, browse available resources, and render prompts provided by a server. It supports both local servers that run over standard input/output and browser-friendly streaming HTTP connections. MCP uses an explicit handshake so clients can learn exactly what capabilities a server offers and adapt their behavior accordingly without relying on hard-coded integrations.
That handshake is where many silent failures tend to occur, and they can be difficult to debug. Common issues include:
If you only test through an agent, all of these problems usually show up the same way: the agent ignores your tool! A protocol-level debugger makes the difference by showing the actual messages exchanged, including the method names and the data the client received, so you can see exactly where things went wrong.
MCP Workbench is the open-source visual debugger for MCP servers. It runs as a hosted version managed by Orkes (mcp-workbench.ai) while also shipping as a GitHub repo you can clone and host locally (conductor-oss/mcp-workbench).
It gives you:
Workbench is a Vite + React UI with a thin MCP client layer. Under the hood there are three pieces:
InspectableTransport TypeScript class so every JSON-RPC message is logged. For non-demo connections, Workbench uses a direct HTTP POST transport that captures MCP-Session-Id headers from responses.scripts/stdio-bridge.js spawns a local stdio server and exposes it at http://localhost:3001/mcp, with CORS enabled for the browser.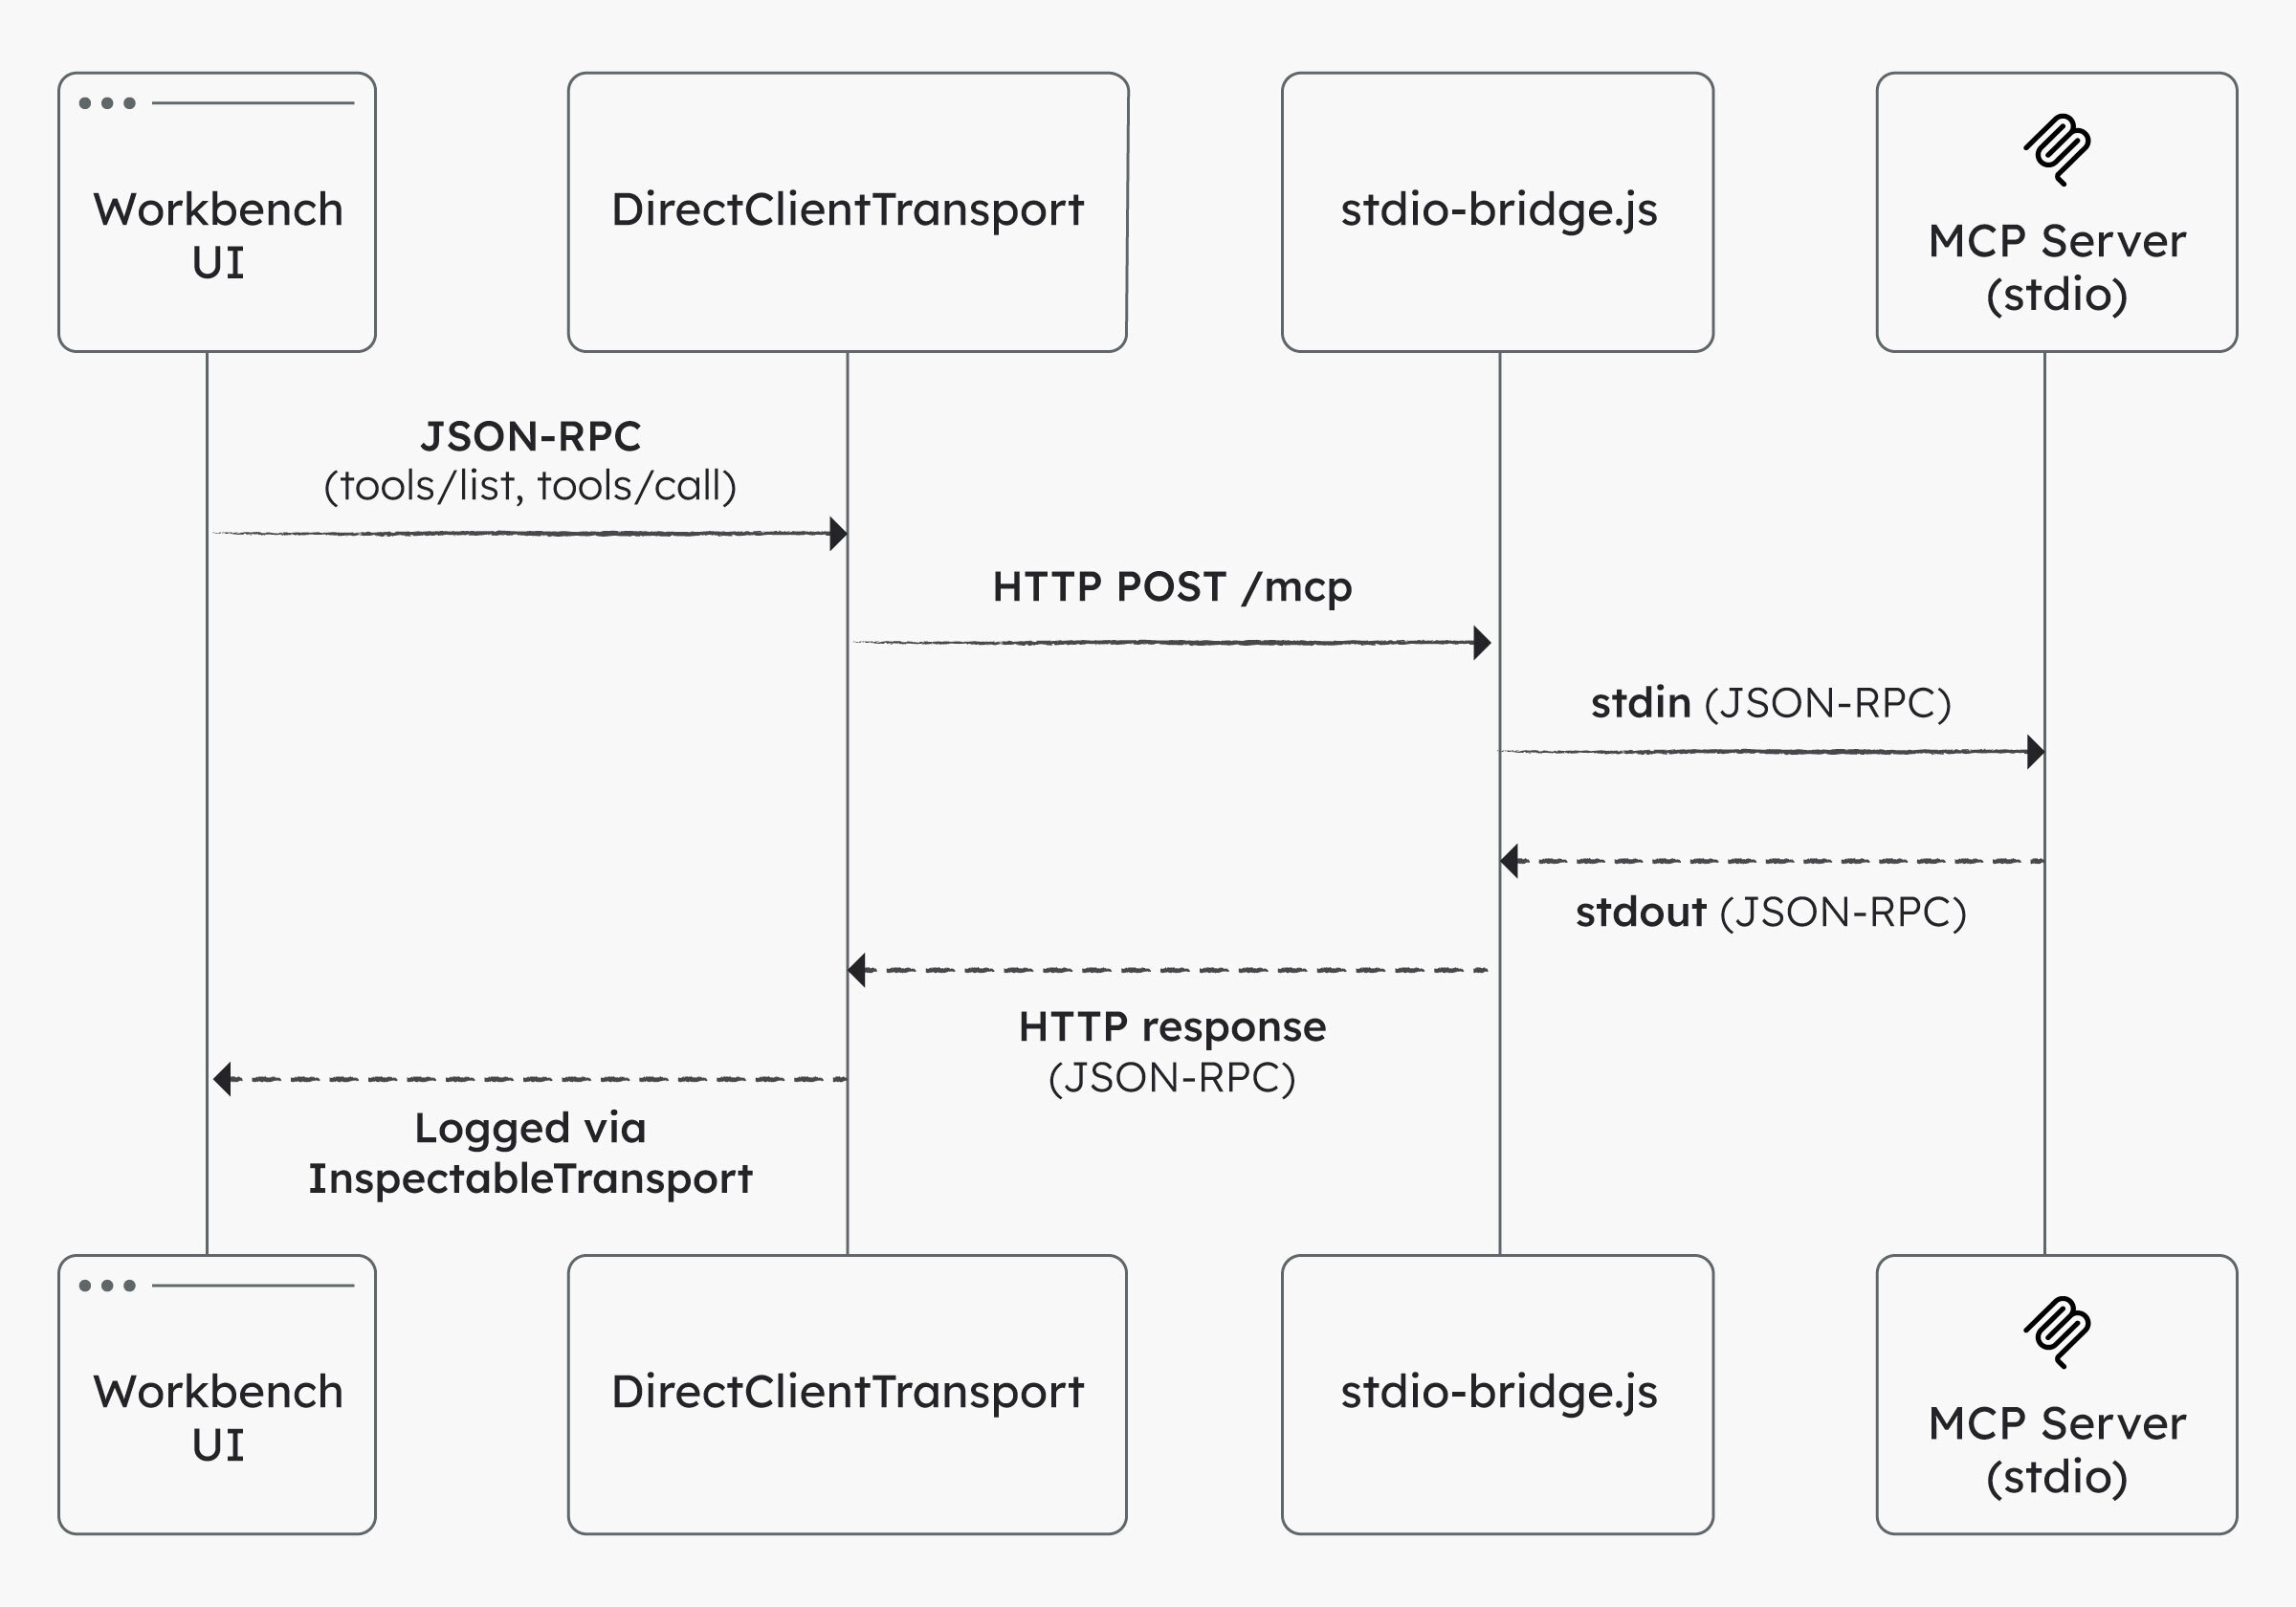
Once connected, the Workbench automatically calls tools/list, resources/list, and prompts/list so you can see what the server actually exposes and inspect the raw responses.
Let’s build a minimal MCP server with one tool that is useful enough to feel real: a risk scoring tool. Since this tool will be deterministic (as opposed to LLMs or agents), it's ideal for protocol validation.
We’ll run it as a stdio MCP server locally, bridge it into Streamable HTTP, and then validate it in MCP Workbench.
Create a new directory and install dependencies:
mkdir mcp-risk-lab
cd mcp-risk-lab
npm init -y
mkdir -p src

npm install @modelcontextprotocol/sdk zod
npm install -D tsx typescript
Create src/server.ts:
import { z } from "zod";
import { McpServer } from "@modelcontextprotocol/sdk/server/mcp.js";
import { StdioServerTransport } from "@modelcontextprotocol/sdk/server/stdio.js";

const server = new McpServer({
  name: "mcp-risk-lab",
  version: "0.1.0",
});

server.tool(
  "risk_score",
  "Compute a simple risk score from likelihood, impact, and control strength.",
  {
    likelihood: z.number().min(1).max(5).describe("1 (rare) to 5 (almost certain)"),
    impact: z.number().min(1).max(5).describe("1 (negligible) to 5 (catastrophic)"),
    control: z.number().min(0).max(1).default(0.5).describe("0.0 to 1.0 effectiveness"),
  },
  async ({ likelihood, impact, control }) => {
    const raw = likelihood * impact;
    const adjusted = Math.round(raw * (1 - control) * 10) / 10;

    const band =
      adjusted >= 16 ? "critical" :
      adjusted >= 9  ? "high" :
      adjusted >= 4  ? "medium" :
                       "low";

    return {
      content: [{ type: "text", text: JSON.stringify({ raw, adjusted, band }, null, 2) }],
    };
  }
);

const main = async () => {
  await server.connect(new StdioServerTransport());
};

main().catch((error) => {
  console.error(error);
  process.exit(1);
});
Add a dev script to package.json:
{
  "scripts": {
    "dev": "tsx src/server.ts"
  }
}
Run the server:
npm run dev
At this point the server is speaking MCP over stdio.
Open MCP Workbench (hosted or local).
Recommended (fastest): use the hosted Workbench at https://mcp-workbench.ai (no install required). Optional: run Workbench locally if you want to customize it, contribute, or if your browser or network blocks a hosted app from calling localhost.
Open:
https://mcp-workbench.ai
Clone and run MCP Workbench:
git clone https://github.com/conductor-oss/mcp-workbench.git
cd mcp-workbench
npm install
npm run dev
Open:
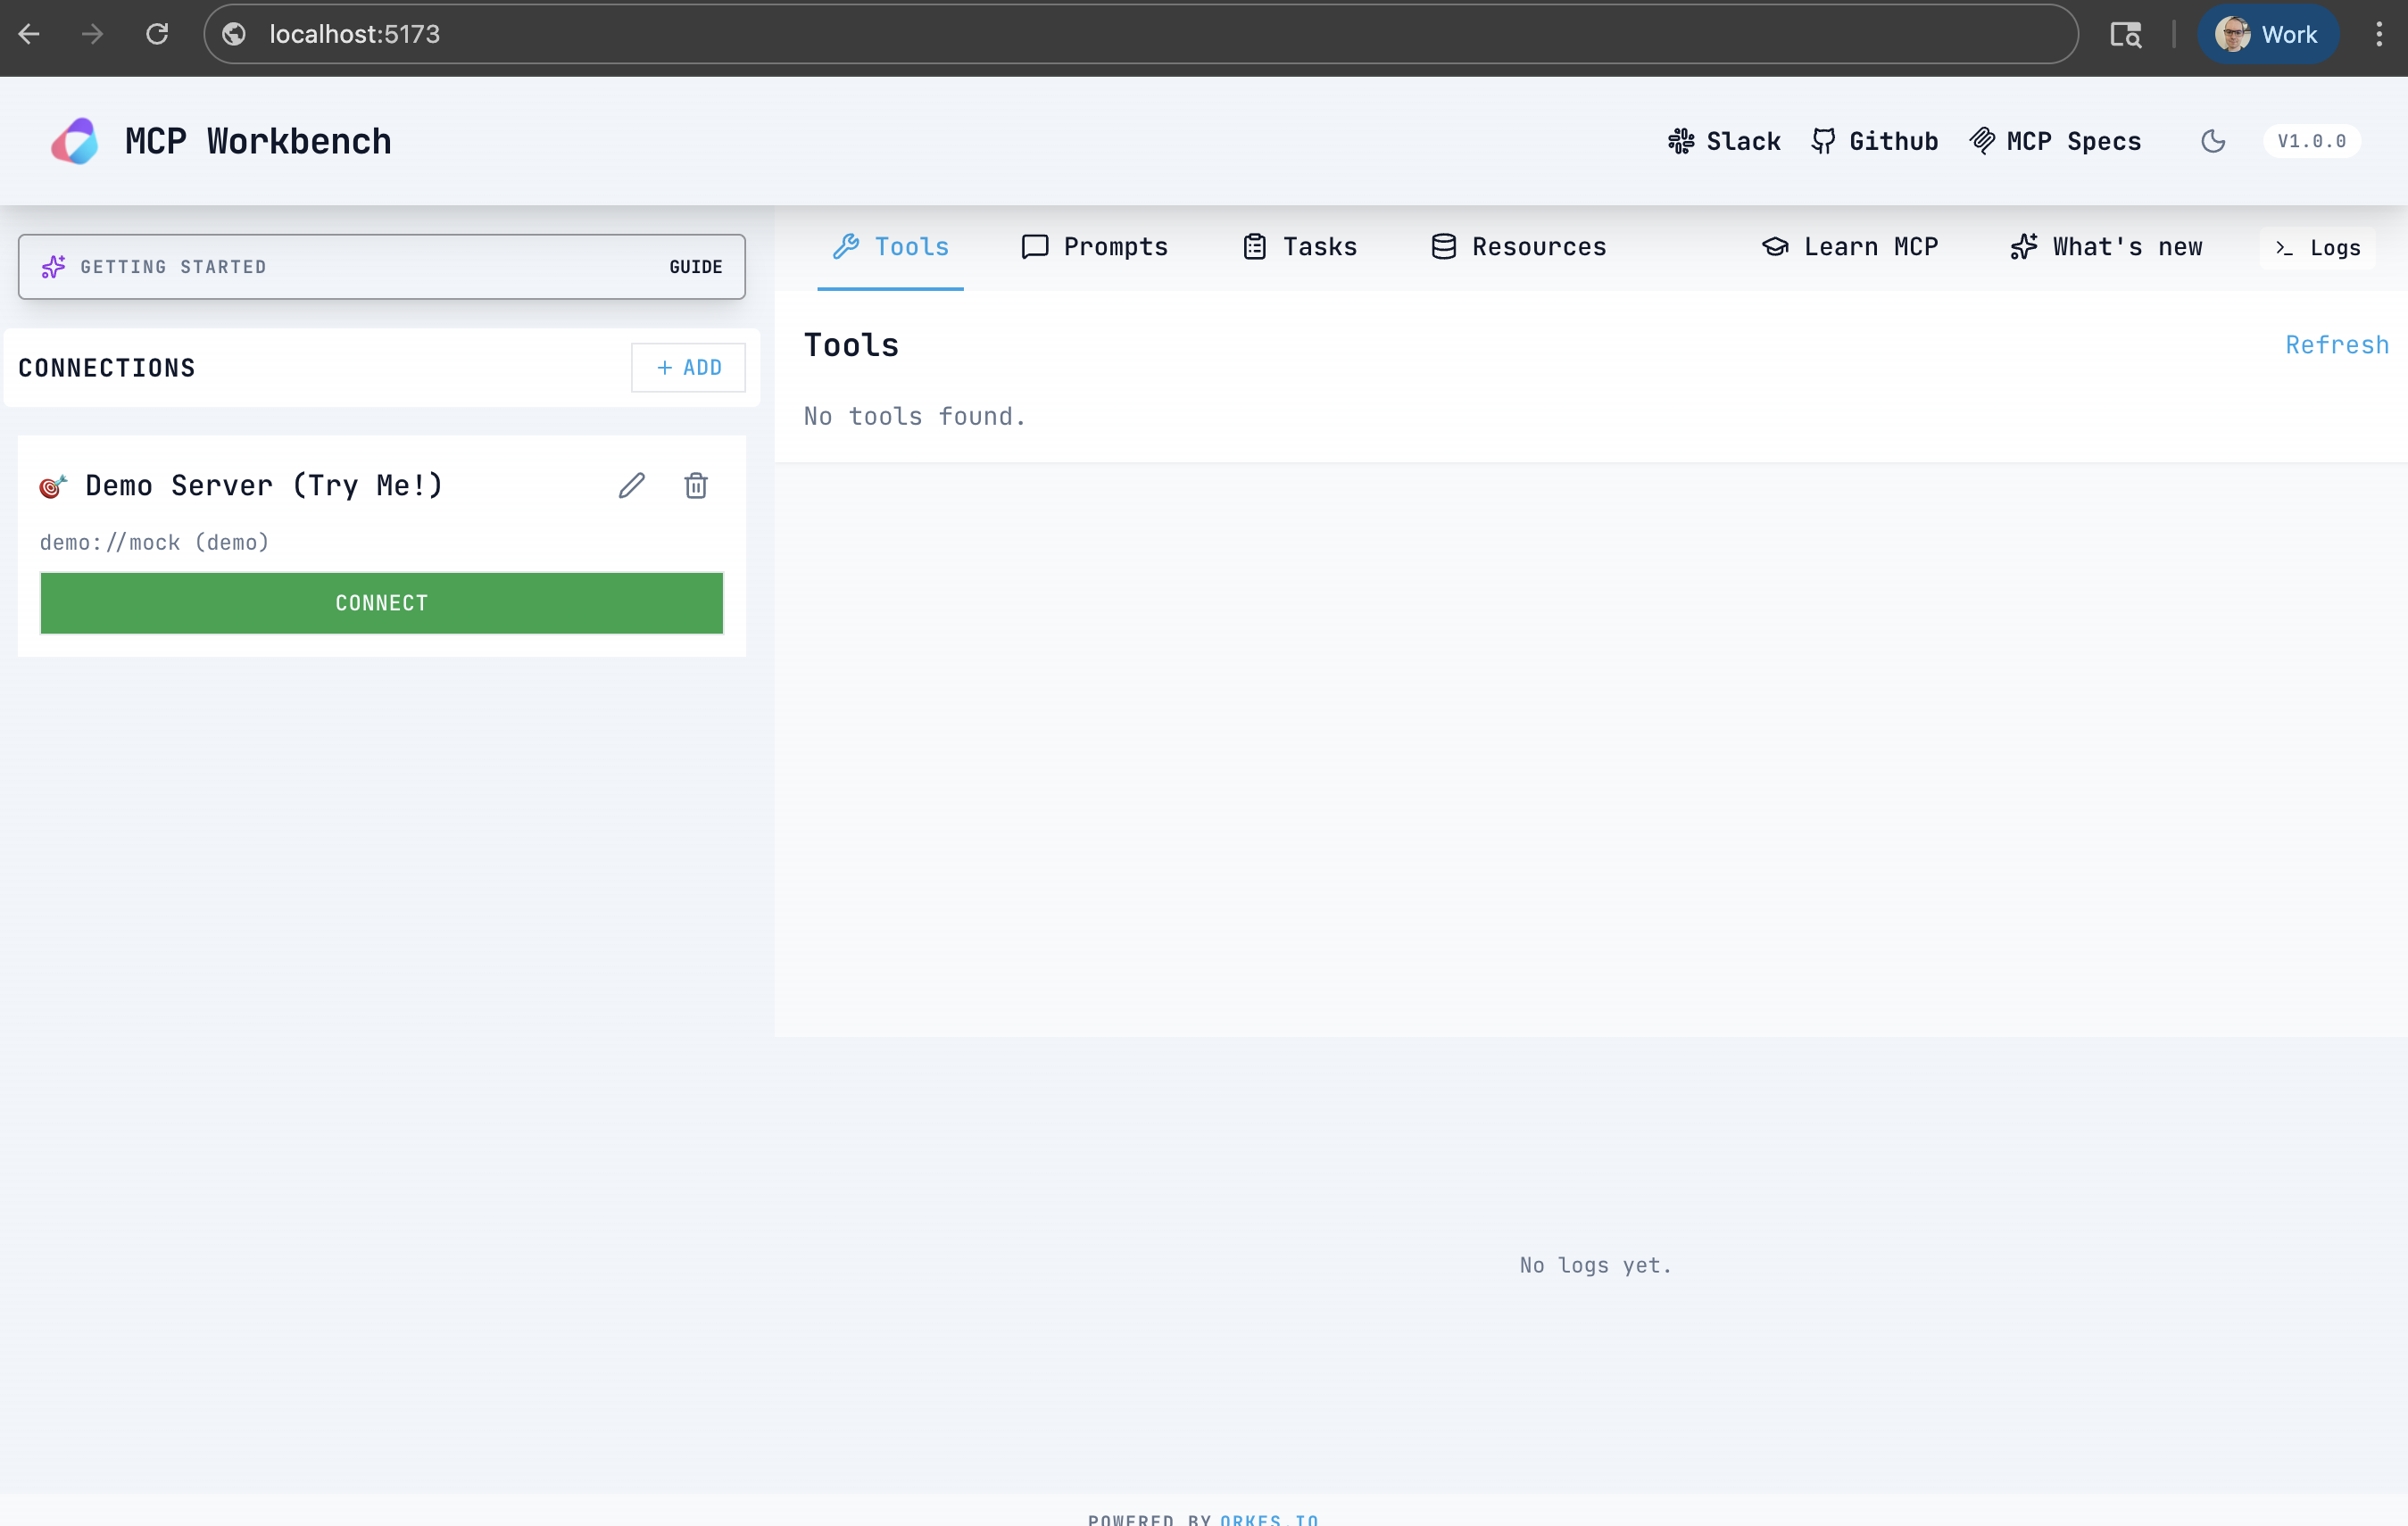
http://localhost:5173
Note: Workbench uses Vite 7, which requires Node 20.19+ or 22.12+ to run npm run dev.
You can use MCP Workbench either as a hosted UI or by running it locally.
Note: For this walkthrough, regardless of whether you are using the hosted or local Workbench, you will need a local clone of the Workbench repo to run the stdio bridge, since it spawns your local MCP server process.
In another terminal, from the mcp-workbench repo, start the stdio bridge and point it at your risk server:
node scripts/stdio-bridge.js "cd /path/to/mcp-risk-lab && npm --silent run dev"
The bridge prints a URL like http://localhost:3001/mcp. In Workbench, add a new server:
http://localhost:3001/mcp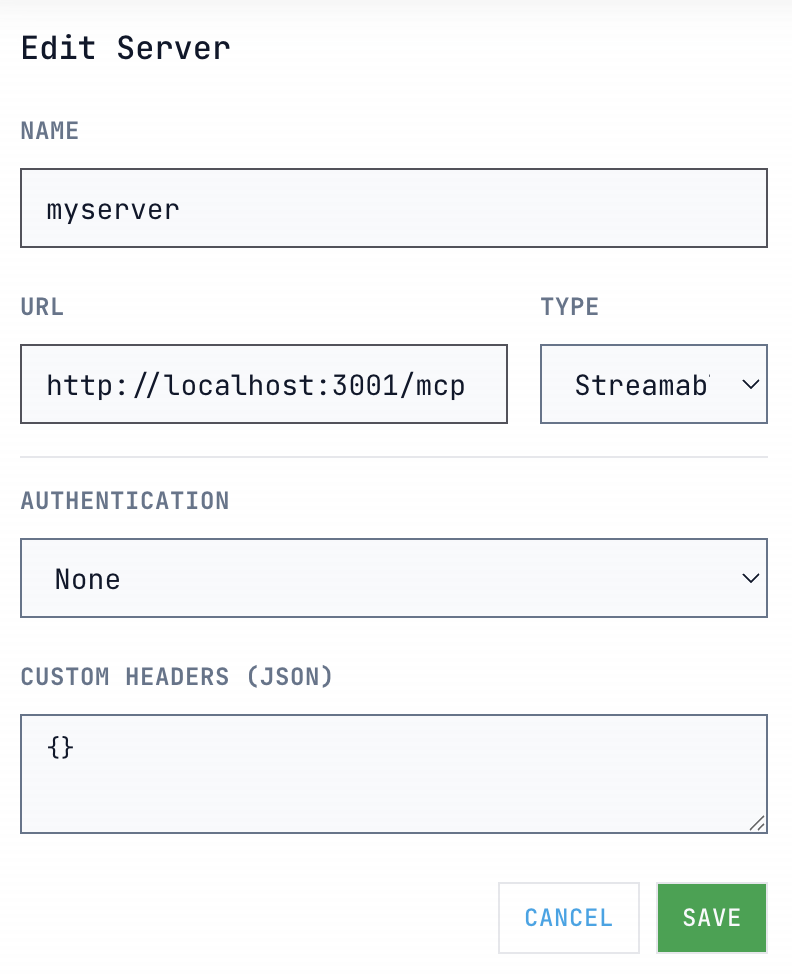
Click Connect. You should see log entries from the toy server immediately start populating.
Note: The bridge already sets CORS headers (including the Safari-only
Access-Control-Allow-Private-Network: true). If you connect directly to your own HTTP server instead, make sure CORS allows the Workbench origin.If Node throws a syntax error on a
#!/usr/bin / env nodeline, remove that line fromscripts/stdio-bridge.jsand retry.
Open the Tools tab, select risk_score, and run it with sample inputs:
likelihood: 4
impact: 3
control: 0.5
You should get a response like:
{
  "raw": 12,
  "adjusted": 6,
  "band": "medium"
}
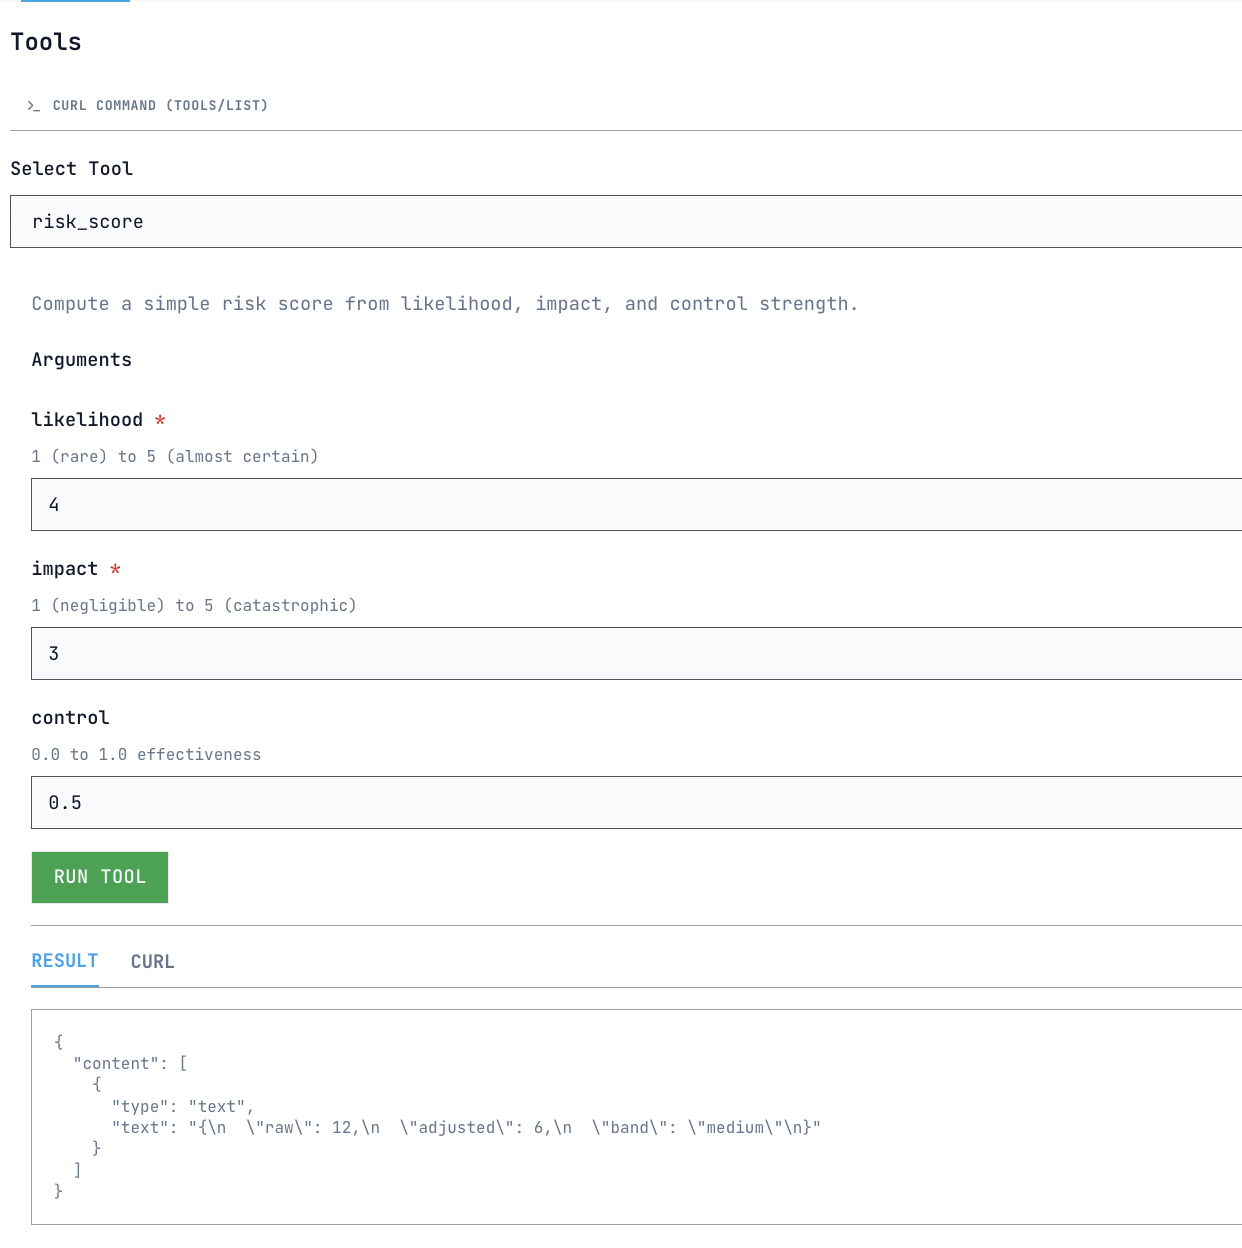
The log viewer will show the tools/call request and the JSON-RPC response side by side.
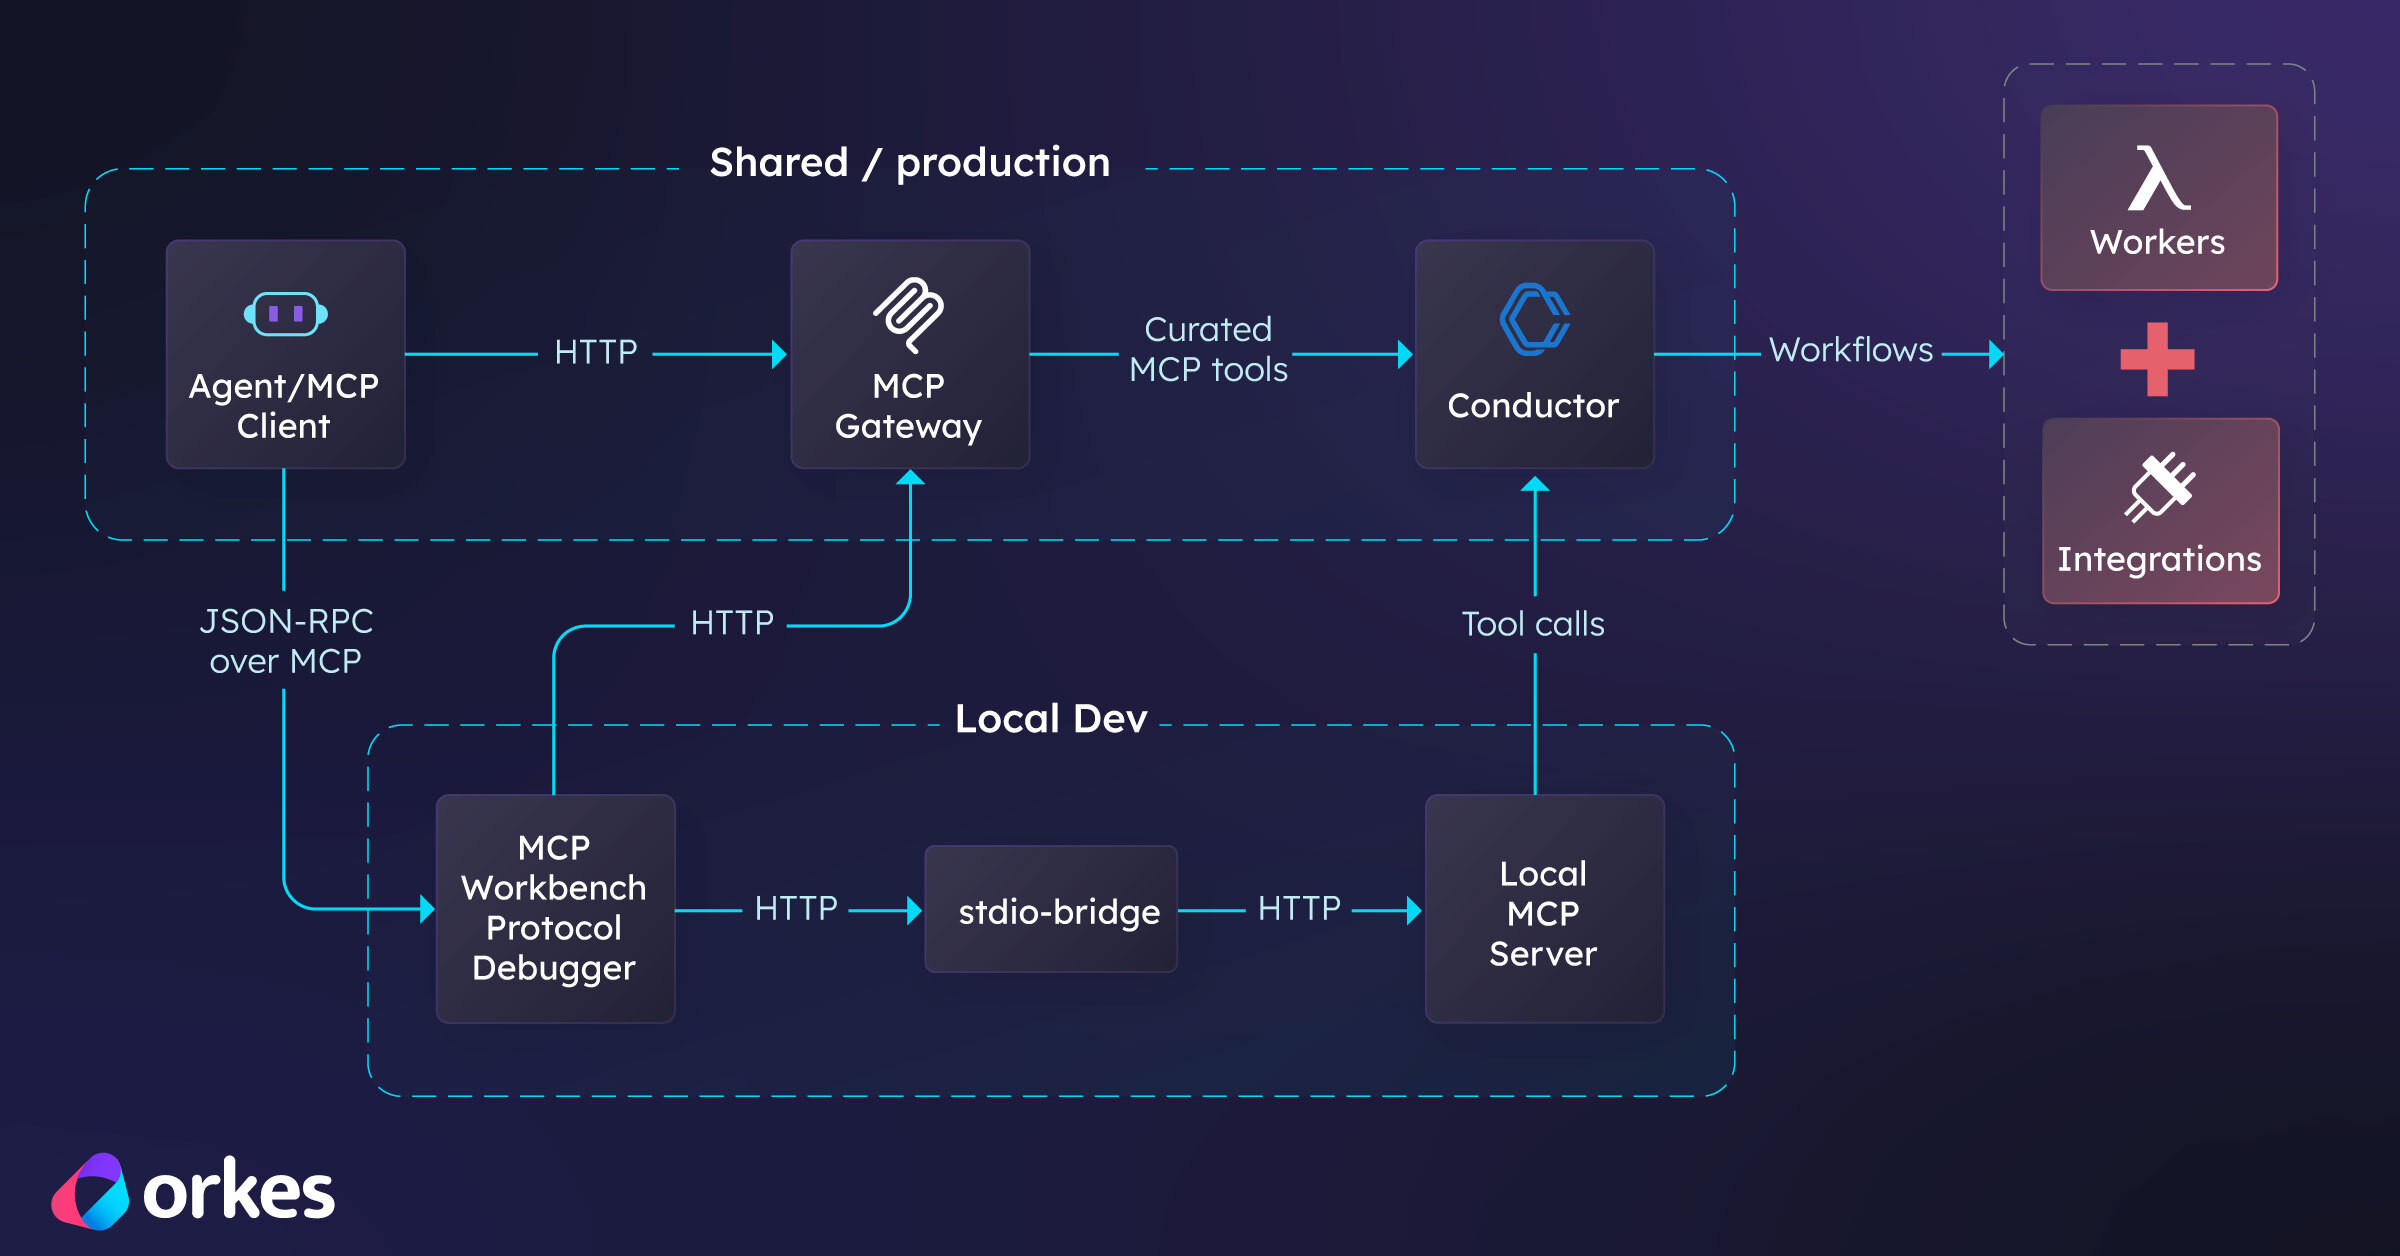
Imagine an AI agent that helps process customer refunds. The agent needs to:
This is a process that unfolds over time, crosses multiple systems, and needs to be tracked and audited. MCP makes it possible for the agent to discover and call tools, but it doesn’t manage the long-running work behind those calls. That’s where Orkes Conductor comes in.
Orkes Conductor is a workflow orchestration engine. Its role is to make distributed work reliable by coordinating multiple steps, handling retries and timeouts, saving state, routing tasks to humans when needed, and providing a system of record for processes that are long-running or prone to failure.
This matters for tool-using agents because real-world work is rarely one-shot. Production tasks usually involve multiple actions across different services. They require audit trails, error handling, and a durable place to store progress that doesn’t depend on what the agent happens to remember in the moment.
The integration model is straightforward: expose Conductor’s capabilities as MCP tools, allow MCP clients to call those tools, and let Conductor handle the execution of durable workflows behind the scenes.
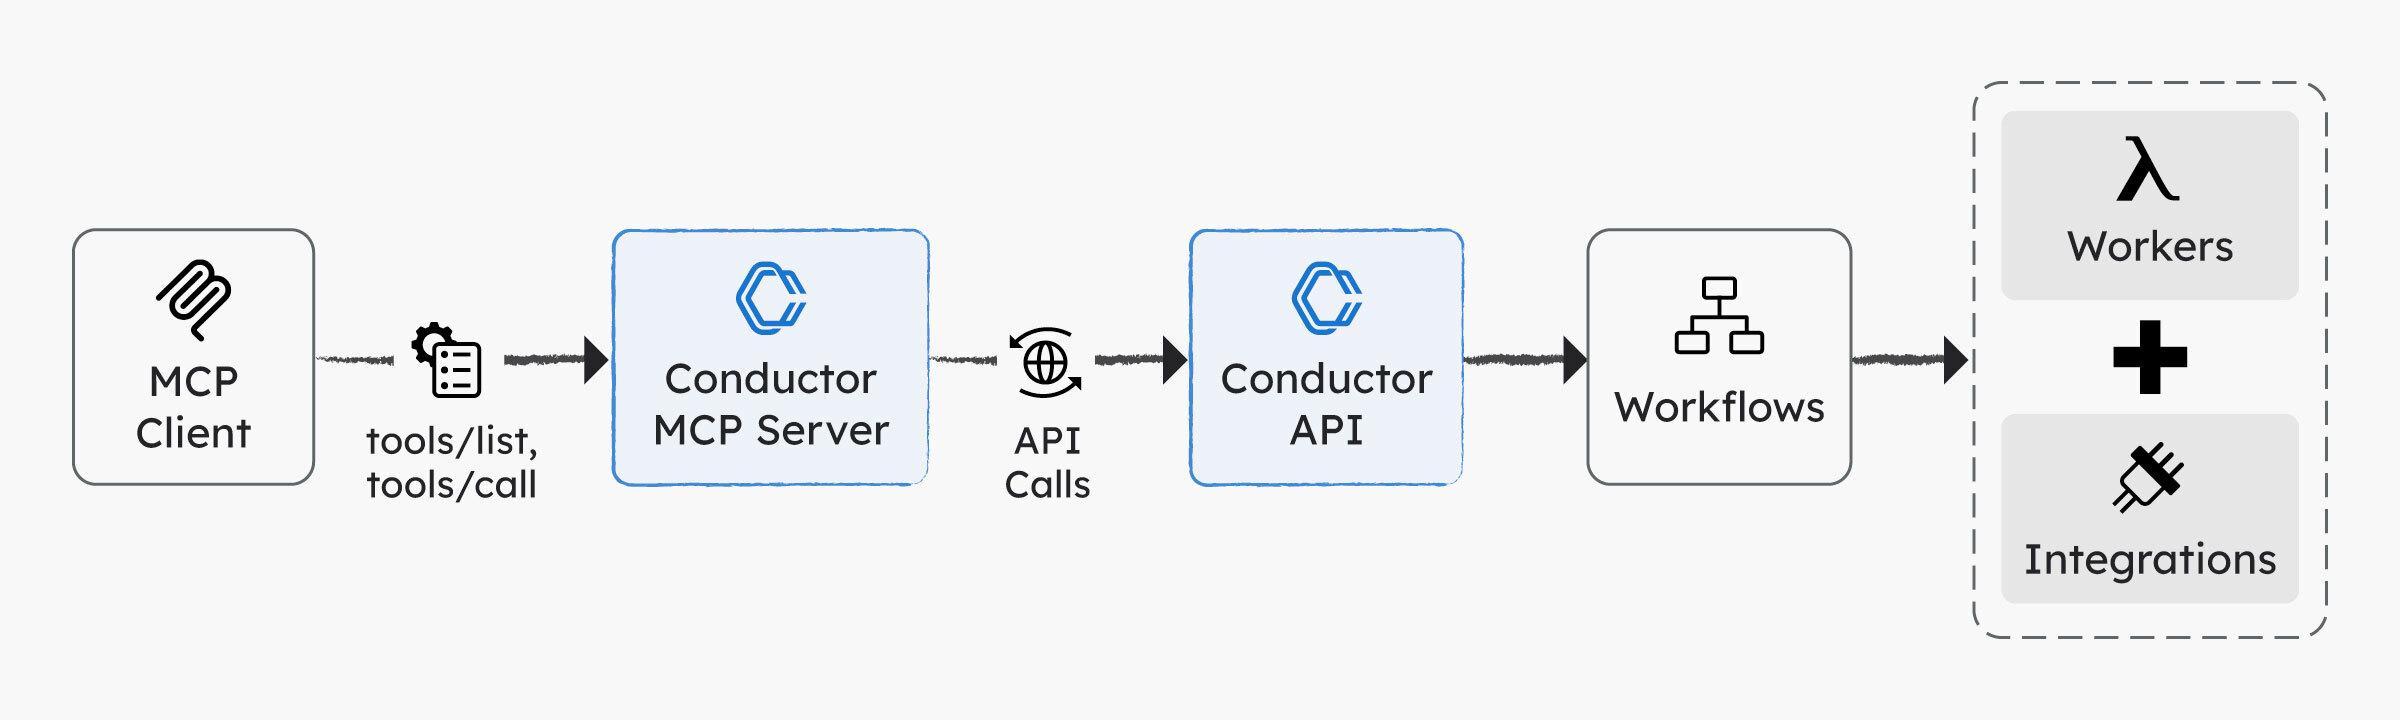
Conductor’s MCP approach follows this model directly. Orkes provides an MCP server that exposes Conductor’s API endpoints as MCP tools, allowing any MCP-capable client to discover and invoke them without custom, client-specific integration work.
In practice, the flow looks like this:
This setup lets MCP handle discovery and invocation, while Conductor ensures the underlying work is reliable, observable, and maintainable.
Once you have that chain, MCP Workbench becomes the place you validate the front half of it: are tools discoverable, callable, authenticated, and returning the shapes you think they are?
Because if you don’t validate that layer, you’ll waste time debugging workflows when the real problem is that the tool call never reached the system.
A good next step is therefore to swap in the Conductor MCP server so you can call durable workflows instead of toy logic.
At a high level:
CONDUCTOR_SERVER_URL (include /api), CONDUCTOR_AUTH_KEY, and CONDUCTOR_AUTH_SECRET.Here is a minimal example using uv (which installs Python 3.13 automatically):
git clone https://github.com/conductor-oss/conductor-mcp.git
cd conductor-mcp
curl -Ls https://astral.sh/uv/install.sh | sh
~/.local/bin/uv sync

cat > ~/conductor-mcp.json <<'JSON'
{
  "CONDUCTOR_SERVER_URL": "https://developer.orkescloud.com/api",
  "CONDUCTOR_AUTH_KEY": "<YOUR_APPLICATION_AUTH_KEY>",
  "CONDUCTOR_AUTH_SECRET": "<YOUR_APPLICATION_SECRET_KEY>"
}
JSON
Note: To create an access key (Key ID + Secret), you first need an Orkes application because keys are application-scoped. See the access control applications guide for details.
From your MCP Workbench repo, start the stdio bridge:
node scripts/stdio-bridge.js "cd ~/conductor-mcp && ~/.local/bin/uv run conductor-mcp --config ~/conductor-mcp.json"
Connect Workbench to http://localhost:3001/mcp. You should see Conductor tools like workflow_get_all_workflows and task_get_all_task_definitions. Tool calls will only succeed once you provide valid credentials.
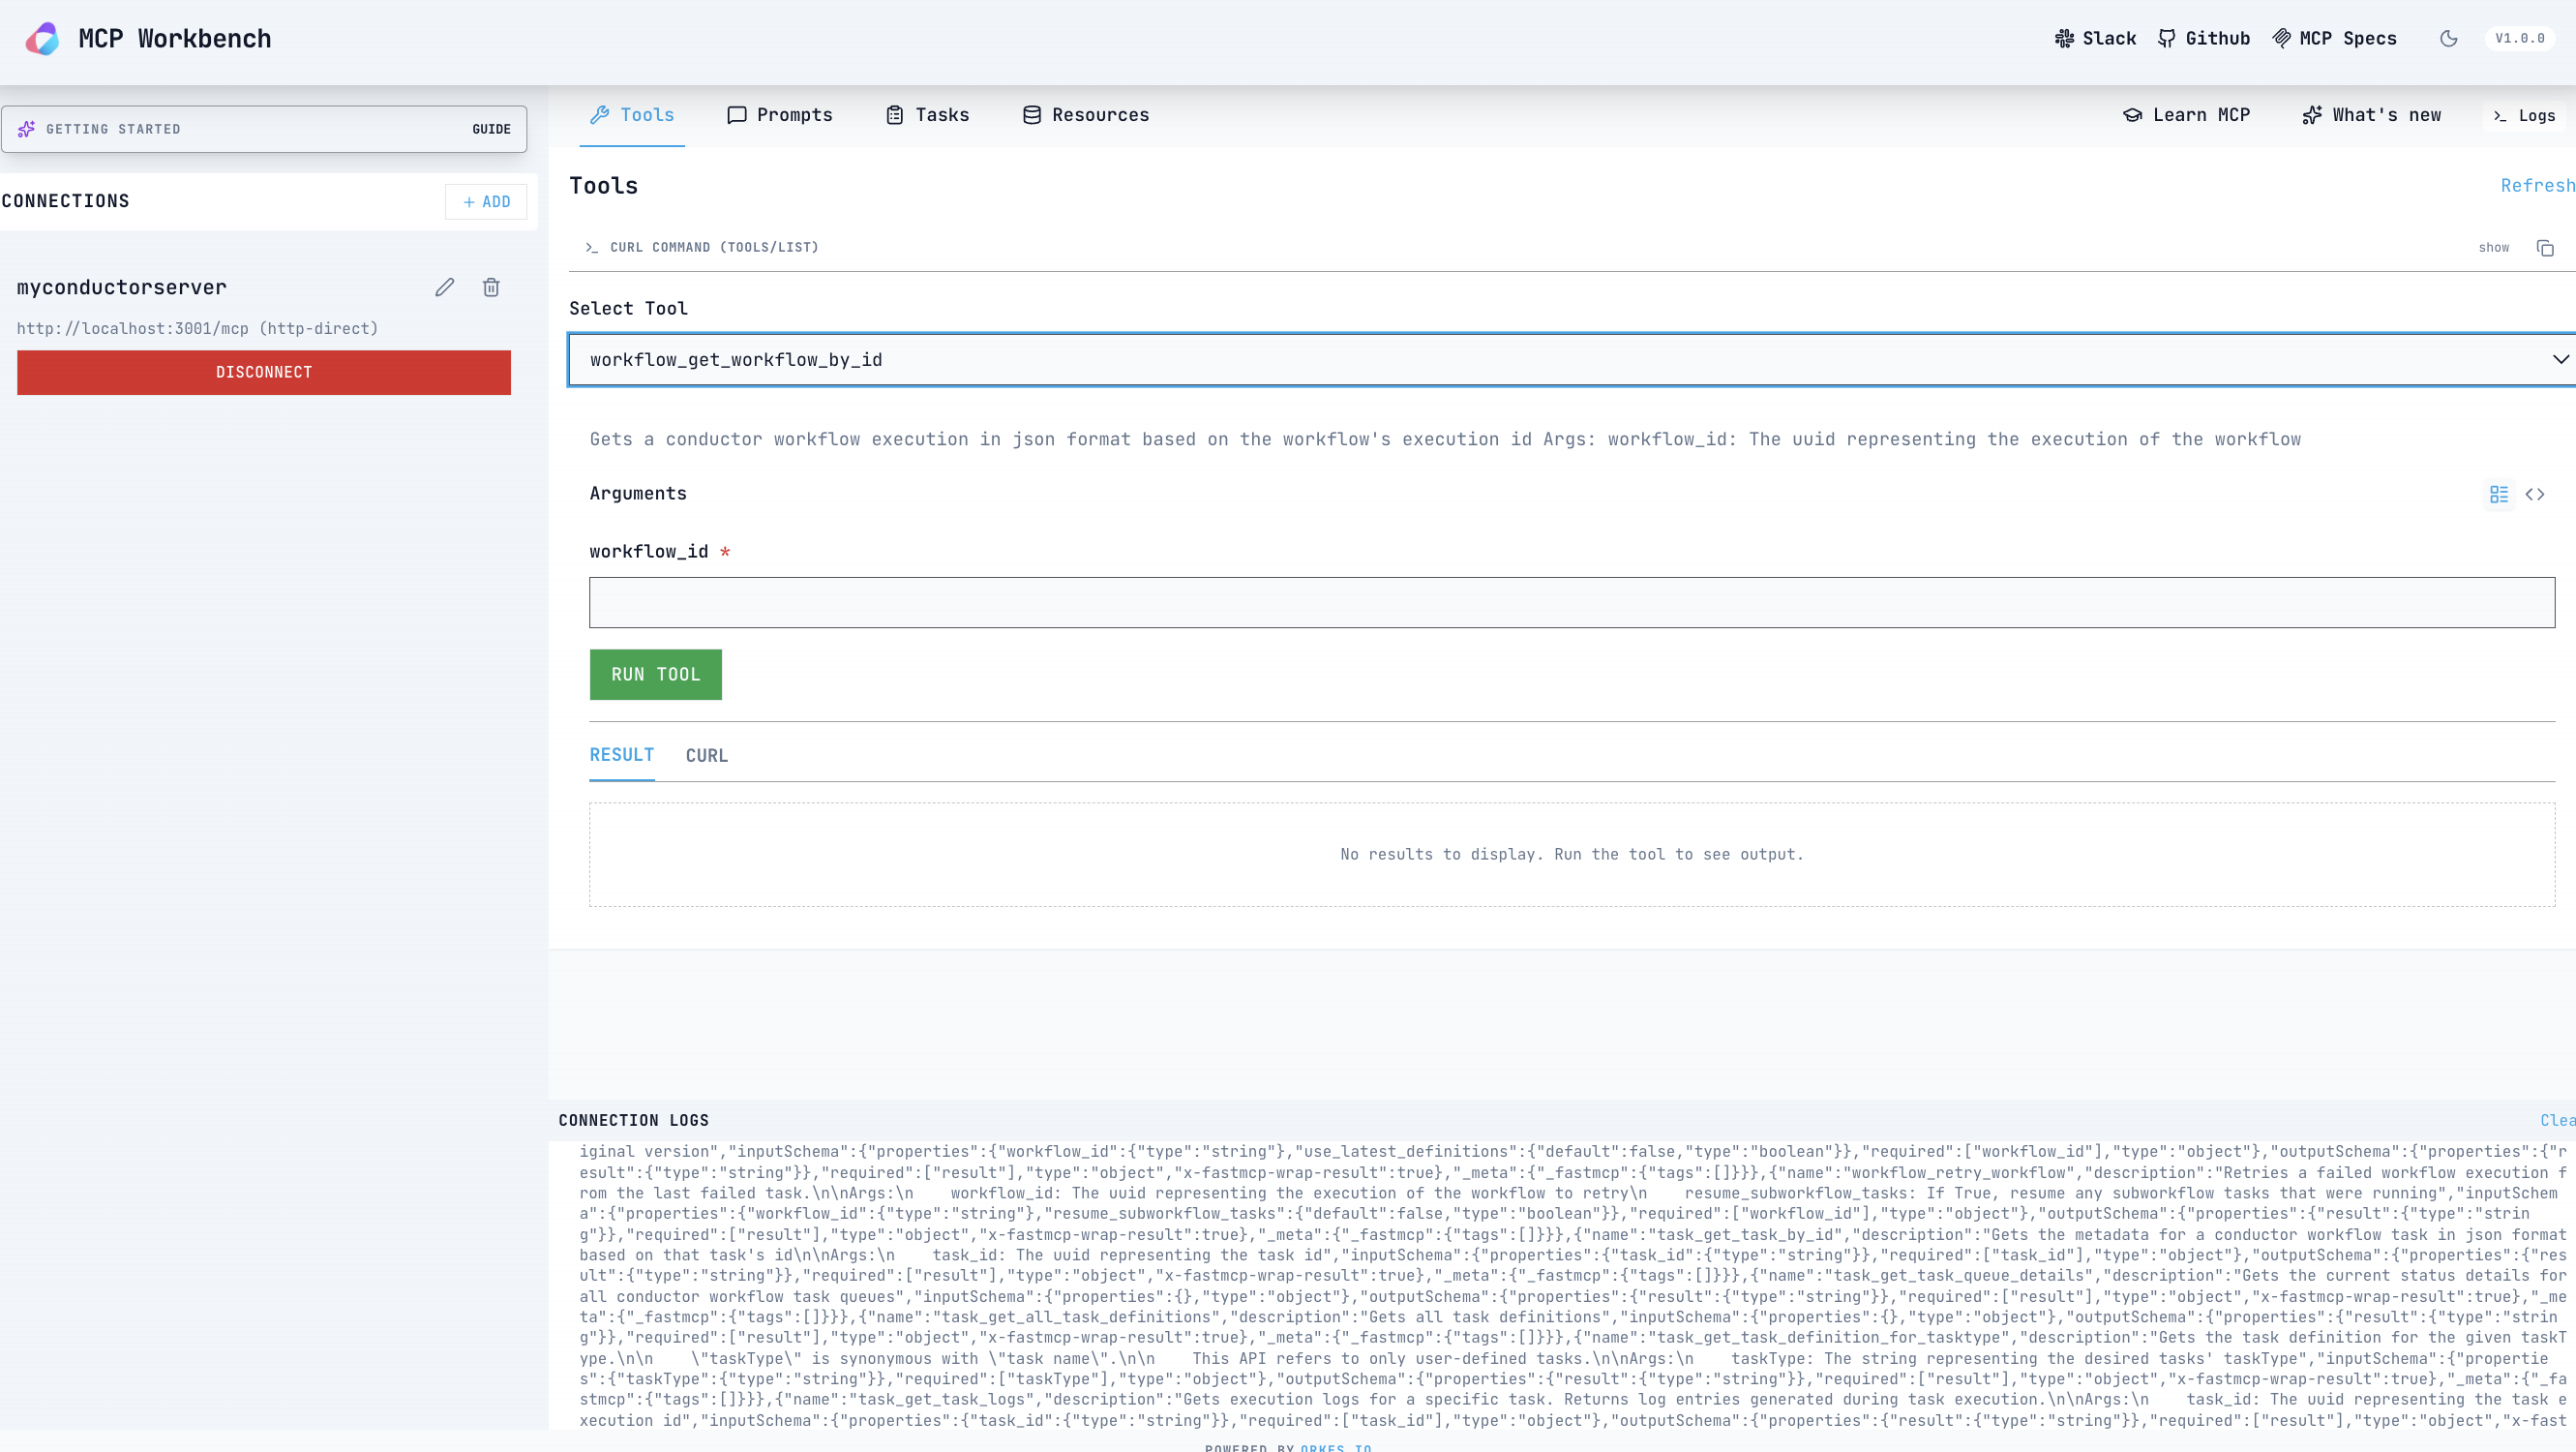
For full setup details, see conductor-oss/conductor-mcp.
The Conductor MCP server is great for local development because it runs as a stdio process you can bridge into Workbench. The tradeoff is that each developer or CI system has to run it and carry credentials locally. When you want a shared, production-grade MCP endpoint, Orkes' MCP Gateway is the better fit.
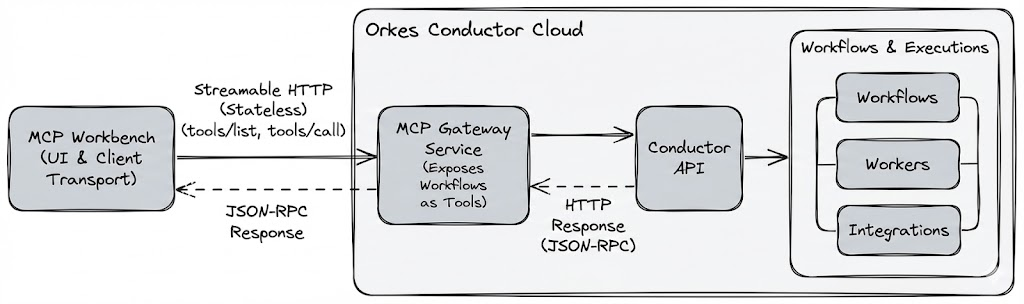
MCP Gateway sits in front of Conductor and publishes a Streamable HTTP MCP endpoint. Instead of exposing every Conductor API directly, you define which workflows or task APIs become MCP tools. The internal Conductor surface is kept private.
You might choose MCP Gateway when:
It also simplifies rollout and governance by observing traffic and storing credentials in one centralized place.
The biggest conceptual mistake teams make with MCP is treating the agent as the first debugging tool. It’s the last. MCP Workbench helps you restore a proper workflow:
First, make the interface correct and observable.
Then, let the agent reason over it.
If you follow that order, MCP Workbench becomes a dedicated protocol inspector, and Conductor becomes the execution layer that keeps real workflows reliable once the agent starts making calls.